Midtown
Net Sales
$48,200
↑ 1.8% vs LY
Labor %
28.4%
Target: 25%
FLM %
49.1%
Target: <46%
Food Cost
$11,840
24.6%
Avg Ticket
$28.42
Period avg
Alerts
2
Active
Cash O/S
-$12.40
Shift close
For multi-unit restaurant operators
A punch edit before payroll. Food usage that sales cannot explain. Refunds concentrated on one shift. OpsIntel processes every store daily and shows you what changed, why it matters and where to act.
Signals
Today by store
Labor % vs 25% target
OpsIntel continuously processes POS sales, food usage, guest feedback and accounting data, then turns it into alerts, daily briefs and recovery actions.
Sales, labor, food cost, alerts and store accountability in one workspace, so you know what needs attention without opening another system.

Total Net Sales
$248,420
↑ 2.4% vs LY
Avg Labor %
26.8%
Target 25%
Avg Food Cost
24.1%
↑ 0.6 pts vs plan
Avg FLM %
47.2%
Above 46% target
Total Orders
18,240
Period 7 · Week 3
Net Sales
$48,200
↑ 1.8% vs LY
Labor %
28.4%
Target: 25%
FLM %
49.1%
Target: <46%
Food Cost
$11,840
24.6%
Avg Ticket
$28.42
Period avg
Alerts
2
Active
Cash O/S
-$12.40
Shift close
Net Sales
$42,100
↑ 3.2% vs LY
Labor %
24.6%
Target: 25%
FLM %
44.8%
Target: <46%
Food Cost
$9,420
22.4%
Avg Ticket
$27.18
Period avg
Alerts
1
Active
Cash O/S
$0.00
Shift close
Net Sales
$39,800
↓ 0.8% vs LY
Labor %
27.1%
Target: 25%
FLM %
48.3%
Target: <46%
Food Cost
$9,680
24.3%
Avg Ticket
$26.94
Period avg
Alerts
1
Active
Cash O/S
+$4.20
Shift close
POS, time clock, inventory, guest feedback and your accounting each hold part of the story. OpsIntel reads them together every day and turns them into a plan for each store.
Data in
OpsIntel engine
processes every store, every day
Insights out
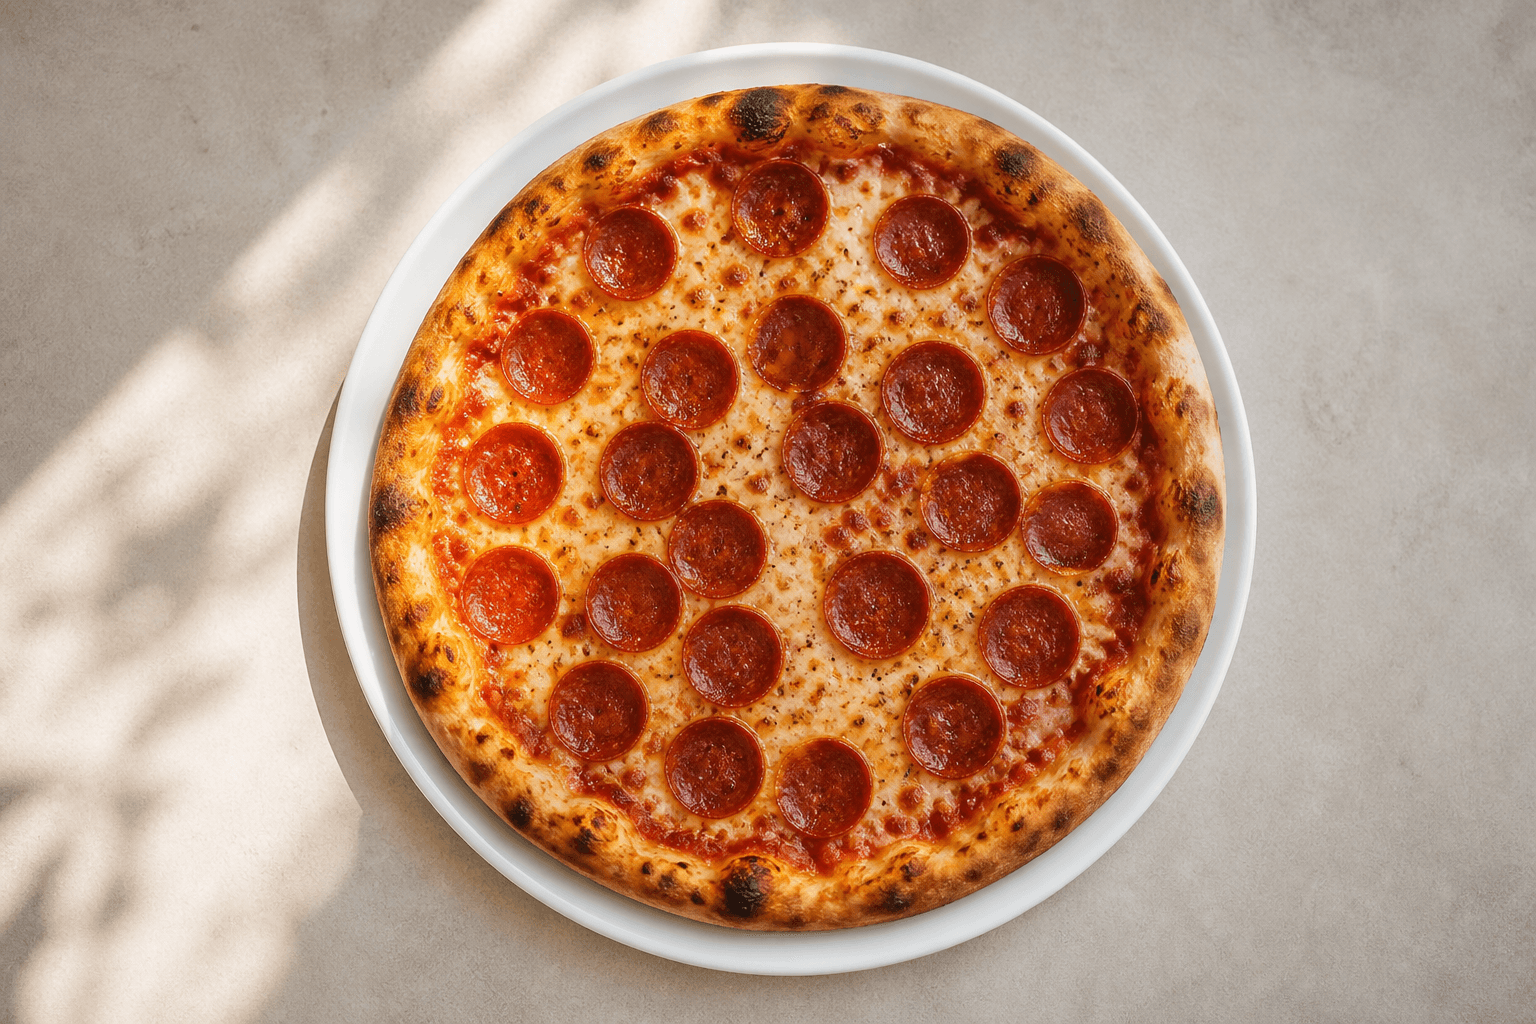
A little extra cheese on every pizza. A few labor hours over plan each week. OpsIntel catches the leaks while they are still small and shows what correcting each one is worth.
Food cost analysis
Midtown
Cheese usage above standard
Observed variance
+8.4%
Weekly impact
$620
Margin opportunity
+2.0%
Labor analysis
Harbor Glen
Actual labor above schedule
Labor variance
+2.1 pts
Weekly impact
$480
Potential overtime exposure requires review.
A void pattern on the same closing shift. A discount used a little too often. A time edit that keeps recurring. OpsIntel connects quiet exceptions into patterns and organizes the evidence, so you can act before they get expensive.
Exceptions flagged
7
Stores requiring review
3
Discount variance
$1,840
Accountability signals
5
| Store | Signal | Category | Est. impact | Status |
|---|---|---|---|---|
| 1002 · Midtown | Unusual discount pattern | Discount | $640 | Check before payroll |
| 1003 · Harbor Glen | Labor override detected | Labor | $280 | Open transactions |
| 1001 · Riverside | High-value refund activity | Refund | $420 | Monitor |
| 1004 · Fairview | Time edit pattern | Accountability | — | Monitor |
$500K
in suspicious time-clock activity surfaced for one franchise group through punch-edit analysis.
The pattern was found in the operational data before it became visible in standard reporting.
Built alongside a multi-unit restaurant operator who was tired of checking multiple systems to understand their stores.
Financial intelligence
Period 7 · Portfolio summary
Net margin
18.2%
-0.8 pts
COGS %
31.4%
+0.6 pts
Profitable stores
4 of 6
On plan
Watch stores
2
Check today
Midtown
Food + labor above plan
Riverside
Discount variance flagged
Harbor Glen
Labor exception
Fairview
Food cost above plan
Your P&L says margin slipped. Your operation knows why. OpsIntel puts synced accounting data next to store-level context, so the number and its explanation live on the same screen before period close.
See financial outcomes alongside the operational signals that influenced them.
Margin, labor, food cost, guest scores, discounts, any store, any period. Intel answers in plain language, grounded in your data, with the context to trust it.
Why did margin decrease?
Which stores need attention?
What changed this period?
Where is food cost above plan?
Which labor exceptions need review?
What trends should I watch?
Store 102 margin declined because accounting costs increased while labor, food, rent, and maintenance finished above plan. Operating volume remained stable, but higher costs reduced profitability.
Always-on monitoring
Shifts change, exceptions happen, and small problems compound quietly. OpsIntel processes every location daily, so issues get caught early instead of being discovered weeks later.
Example signals
OpsIntel signal
Unusual punch-edit pattern detected
Check the edits at Fairview before payroll closes.
OpsIntel signal
Refund activity concentrated on one shift
Open the related transactions at Riverside.
OpsIntel signal
Food usage exceeded expected yield
Compare Midtown usage with recorded sales.
Illustrative sample data · Westline Pizza Co.
Three surfaces operators live in daily, backed by deeper modules for every corner of the operation.
Live portfolio view of store health, active alerts and follow-ups, one login instead of six.
Learn MoreDiscount exceptions, void activity and punch edits, organized with order context so patterns are easy to review.
Learn MoreAsk questions across operations, labor and financial data. Answers arrive with period context and a recovery plan.
Learn MoreBuilt for multi-location operators
Sales live in the POS, hours in the time clock, invoices in accounting, and guest scores somewhere else entirely. Reading all of it every day is a job nobody has time for, so it goes unread until period close. OpsIntel does the reading and hands you the part that needs a decision.
Your data. Our agents. Every day.
The demo runs on the live product, with your questions answered on real screens.